Turn your data into meaningful insights.
Whether you've gathered your own research data or located existing datasets, analysis is key to uncovering meaningful insights.
Our team of specialists are here to answer all your questions and provide guidance throughout your data analysis and visualization process. We recommend you schedule a consultation early in your project so we can help set you up for success.
Organize Your Data
Before diving into data analysis, make sure you have well-prepared data. Good metadata practices—like labeling and organizing—ensure you’re working with accurate information that's easier to manipulate. Connect with a specialist early on to prep your datasets for action!
Data Analysis
Data Analysis
Transform your data into valuable insights with our support! Research Data Services can help
- work with textual, numeric, image, spatial data and GIS,
- establish reproducible research workflows,
- write publication-ready code in R and Python,
- create powerful visualizations that tell the story of your data,
- and more!
Qualitative Analysis
When you think of data, you might picture numbers and statistics, but data includes much more. Texts, artworks, music, and other unstructured forms of data provide deep, nuanced insights that need special approaches for understanding. That can look like:
- Broad Definitions
- Data Humanism and Critical Data Science Approaches
- Addressing Subjectivity, Imprecision, Interpretation
- Working with Qualitative Sources
- Storytelling
Data Modeling
Data modeling plays a pivotal role in understanding and predicting behaviors, trends, and outcomes. Here are some of the key data modeling domains the Libraries specialize in:
- Machine Learning
- Artificial Intelligence (AI)
- Statistics
Research Data Services can help you create accurate, reliable, and insightful data models for your research questions.
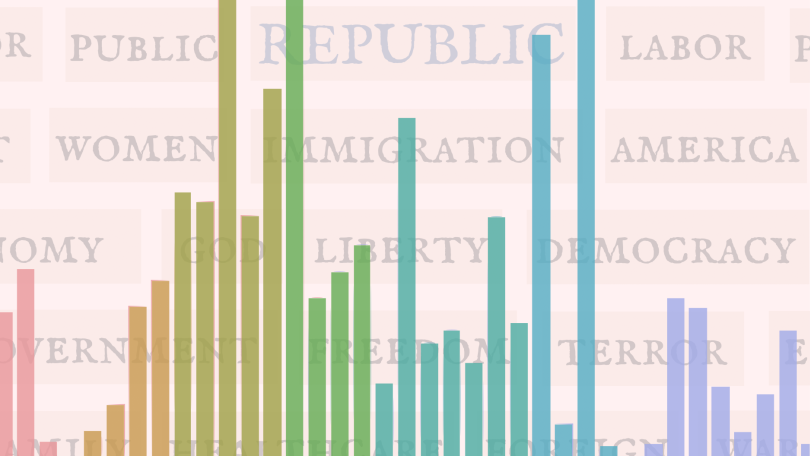
Text Analysis
Text Analysis
You can use text analysis to search, manipulate, and explore a large body of text-based information, such as multiple works by a particular author or an aggregate of social media posts. This technique allows you to answer questions on how texts are connected, what sentiments they contain, and when key terms change within a collection.
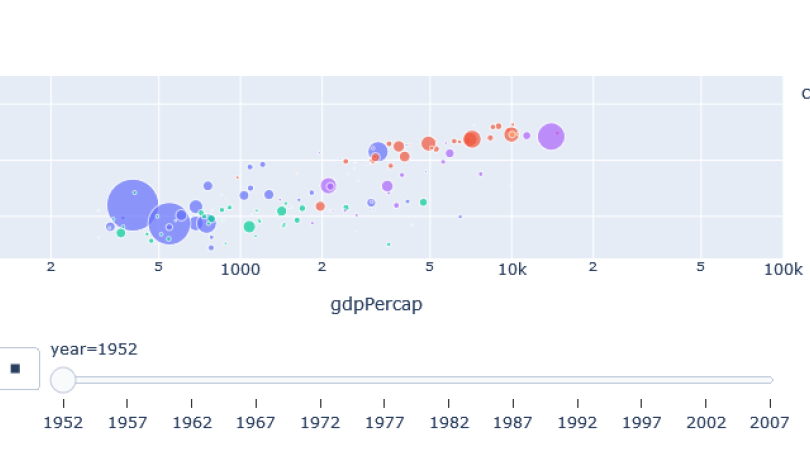
Visualization
Visualization
Unlock the storytelling potential of your data! Visualization is a powerful means of exploring, understanding, and sharing data. It transforms complex data into intuitive, insightful, and visually engaging representations. Some visualization techniques include:
- Data Storytelling
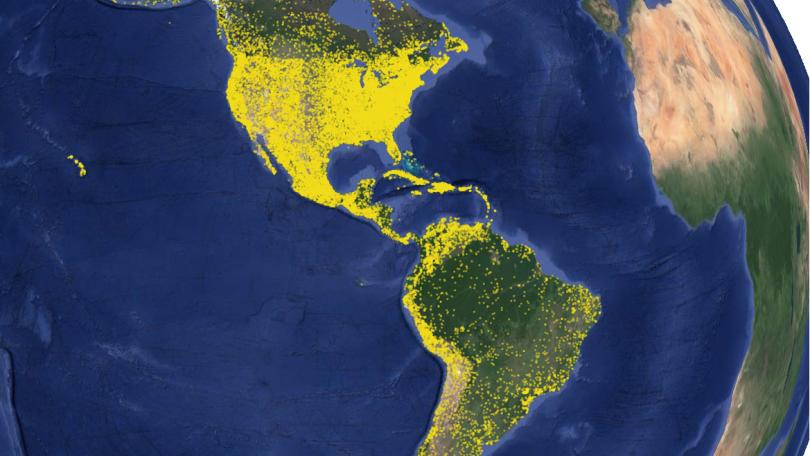
- Mapping
- Reporting & Dashboarding
Contact Us
We support your data project from the moment you begin research to the end of the lifecycle. All our team members are experts in their field and can help you with your data and computationally-intensive scholarship.
- Email: research.facilitation@dartmouth.edu
- Phone: 603-646-3845